



Q&A: Engineers Deploy to Study California’s Storm-Battered Coast
Hurricane Marie ravaged the Southern California coastline in early September. Ocean swells from the tropical storm stripped sand from beaches between Malibu and Dana Point, weakening shore protections and triggering coastal bluff failures.
The Geotechnical Extreme Events Reconnaissance Association, or GEER, sponsored by the National Science Foundation, deployed a team of University of California researchers to document and better understand Hurricane Marie’s damage.
Michael Gardner, an assistant professor of civil and environmental engineering at the University of California, Davis, co-led the research with Anne Lemnitzer of UC Irvine. The multi-campus team mapped the eroded profiles of the beaches with LiDAR scanners and GPS and used surface-wave testing and dynamic cone penetration to characterize the remaining sand.

We spoke with Gardner to learn more about this effort, what the team found and what the damaged coastline might tell us as California braces for what could be the strongest El Niño ever recorded this winter.
Can you explain how this project came together? How did GEER come to select you and Anne Lemnitzer?
GEER exists to put researchers in the field within days of an extreme event, and the Marie deployment came together that way: as a multi-institution team organized by GEER to document how the coastline changed in Southern California. Anne and I have now been in the field together three times — the Ahr Valley in Germany in 2021, Yellowstone in 2022 and now the Southern California coast — and that experience is worth a great deal when you are very quickly assembling and deploying a team. There is also something fitting about two UC campuses working together on an event directly impacting California’s own coastline; this is exactly the public-service side of what a state university system is for.
The National Science Foundation-supported NHERI RAPID facility at the University of Washington was central to making the project work. RAPID supplied much of the instrumentation and deployed staff who went with us, which is what allows a team assembled in days to show up with equipment it could not otherwise field.
Can you explain the stakes of the deployment? How small of a window did your team have before the data were lost?

The window is on the order of days, and the window closes for two reasons.
The first is visible: the coast reworks itself. A fresh erosion scarp is rounded off by the next few high tides, so the profile we measure a week or two later is not the profile the storm left. At the same time, recovery and repair operations are fast: crews push sand back into place, dump rock, pump out flooded streets and red-tag or demolish damaged structures, because public safety cannot wait for researchers.
The second reason is less visible. The surface tells you how much sand moved; it does not tell you what is underneath it. The surface-wave and cone penetration tests we run characterize how the beach is layered and what condition those soils are in after the storm. Once fill is placed or the beach begins to rebuild, new material modifies that record and the post-storm condition can no longer be measured. This is the core of the GEER model, where we mobilize as quickly as possible to collect the perishable data before it and the opportunity to learn from it is lost.
How rare is an opportunity like this in California? What can the data tell us?
Swell from an eastern Pacific hurricane that does this much damage to the Southern California coast is uncommon. What makes this deployment important is less the storm than what we measured. California’s shoreline is well monitored: the U.S. Geological Survey surveys beach and nearshore change at sites up and down the coast, some of those records two decades long, and Scripps Institution of Oceanography has sustained work on beach width and cliff erosion.
The data we collected simultaneously captures both the topography of the eroded beach and the characteristics of the soils beneath the surface. That is the gap these data fill, and the timing matters. Forecasters now put a strong-to-very-strong El Niño at better than 80% through early 2027, and these measurements become the "before" condition for further change to the coast over the winter.
Will the data you collected inform practices or policies during the upcoming El Niño season?
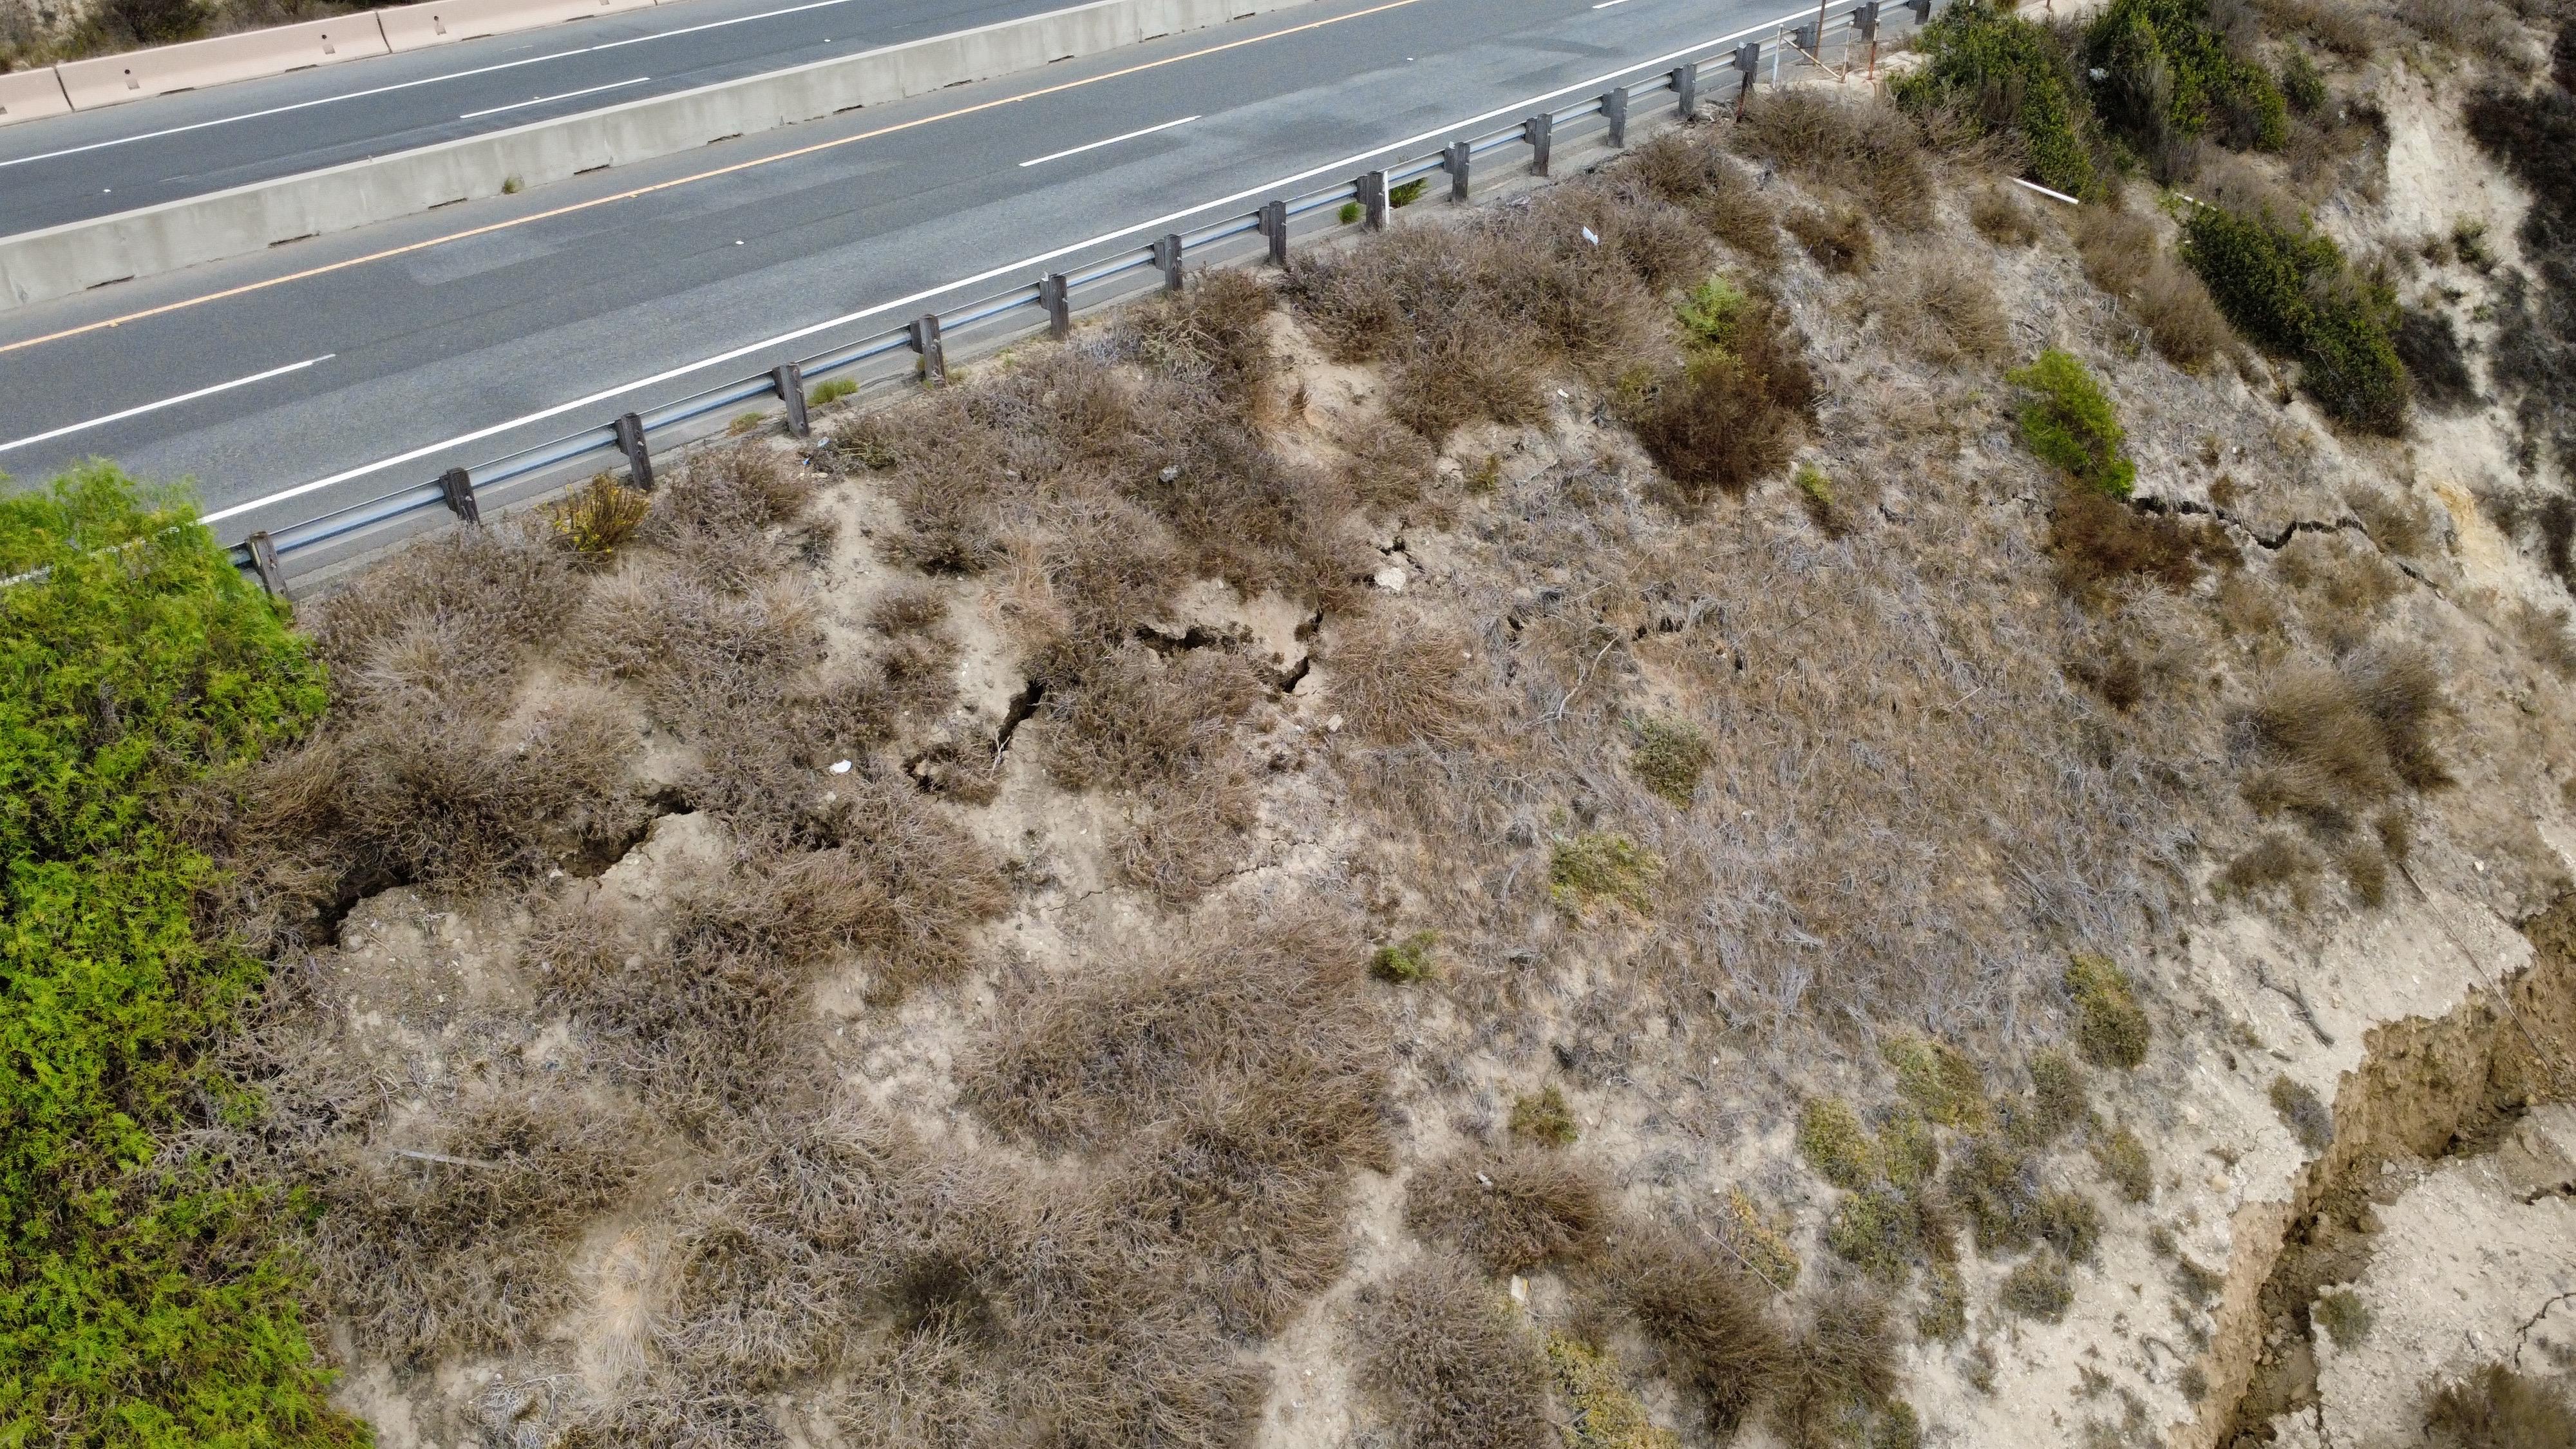
I would be careful about promising policy change on a seasonal timescale. That is not how design guidance moves, and I would rather be accurate than optimistic. But the question has a concrete answer from this deployment. While taking additional measurements near Crystal Cove, Anne found a large crack in the coastal bluff and reported it to Caltrans, which closed a lane of Pacific Coast Highway. That is a decision made on a timescale of days, on the basis of something a team happened to be standing in front of.
What the data can do this winter is more concrete: they give agencies and researchers a documented baseline for specific stretches of coast, so that when the next damage occurs there is a measured "before" to compare against instead of an argument about what the beach used to look like. The GEER report and the archived data set on NHERI DesignSafe will be public, so coastal engineers and agency staff can use them immediately. The influence on design practice comes later, through the models and guidance that get validated against observations like these.


